cloudera, Big Industries Academy


Why you should read this article
You will …
- find out what tools one might use to do geospatial visual analysis using large volumes (billions of datapoints)
- be (hopefully) convinced that geospatial big data can be of use in a tremendous array of sectors
- see an example of the cool technology Big Industries is working on
- see a sample architecture to visualize geospatial big data using the GeoMesa/HBase/GeoServer stack
- [in an upcoming blog post] …be provided with a handbook with errors/solutions while working on this stack
Some examples of geospatial big data
One could refer to geospatial big data as spatial data sets exceeding the capacity of traditional, non-distributed, computing systems. Not surprisingly, such data is ubiquitous: every day, millions of mobile and IoT devices along with many airborne and satellite remote sensing platforms generate petabytes of recordings with information that includes a time and a location. Various examples of the analysis of geospatial big data come to mind:
- Moving vessels can send out their location at a high frequency to prevent collision.[1]
- Twitter posts and their posters’ locations can be analyzed to reveal how an opinion spreads geographically over time.
- Recurrent transportation routes can be visualized to aid in finding anomalies.
- Cellphone data can be used to identify areas in which social distancing is not being respected in times of Covid.
- Aircrafts can determine their position via satellite navigation and periodically broadcast it.[2]
- High resolution satellite images of agricultural fields can be used to monitor crop development.[3]
Why is geospatial big data important to our clients?
We encounter many clients that gather geospatial data. Most of the time, our clients want to become data-driven: they want their data to provide them with answers, and they want their investments to pay off as efficiently as possible. Once a client embarks on a data-driven journey, the first step is to get their new data platform fully configured and up and running. Then onboarding of data begins. They can now quickly run queries against millions of records. By aggregating and combining different datasets, we can begin to answer some of the client’s questions. But this still limits the use of this data to experts in these rather complex technologies. Analysts from other departments who want to use the geodata don’t necessarily have the time to train themselves and become proficient in such technologies. This can prevent the client from unleashing the full potential of the system they have invested in.
The next step, then, is to make all of this hidden gold available to a wider range of users who can access it in a more user-friendly way. A common approach that meets this need is to use visual representation. The client needs a system that allows the selection of a portion of the geospatial data and, on the basis of some input, can fast and dynamically (i.e. depending on the specific selection of the user) show only the data that meets the chosen filters. This is exactly what the GeoMesa/GeoServer/HBase stack can offer.
What tools can I use?
Below an example architecture to tackle the problem:
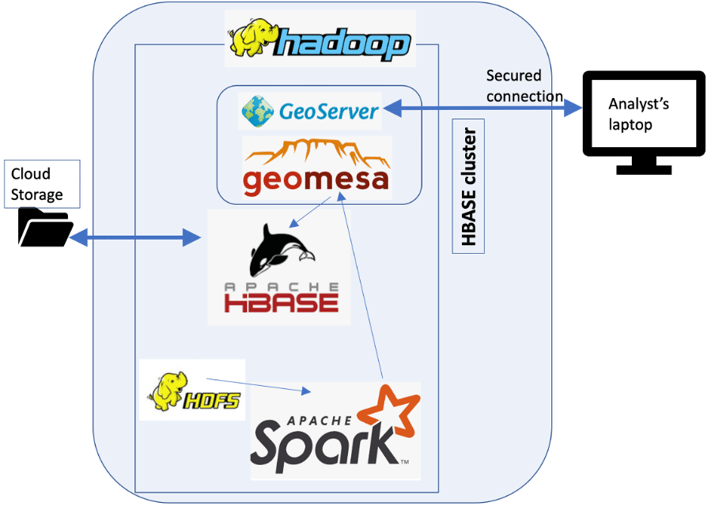
This consists of the following items:
- GeoMesa[4]: a tool for large-scale geospatial analytics on distributed computing systems; a geo datastore that can store geodata in several different datastores (like HBase).
- GeoServer[5]: a server that allows the editing and viewing of geospatial data. Can ingest any type of geospatial data in all common formats. Can be connected to several big data stores by connecting to GeoMesa.
- Hadoop cluster with Spark for processing and HBase as a nosql DB.
- Economic data storage through cloud storage: HBase could be backed by s3 (AWS) or by adls (Azure).
How does this fit into the Big Industries portfolio?
In recent years, Big Industries’ scope has broadened from Big Data to data-driven and cloud projects in general. But in the early days, we started as a Hadoop-oriented company. Big Industries has had a long and fruitful relationship, dating back to 2014, with the oldest surviving player in the landscape of commercial Hadoop platforms, Cloudera, resulting in a “Silver” partnership. This makes us the company in the Benelux with the longest track record of working on Hadoop platforms. This is certainly no secret among clients making use of Hadoop, as we have recently seen a surge in requests to participate in the upgrade of older Hortonworks or CDH 5.x/6.x platforms to the latest Cloudera Data Platform (CDP).
Try finding a data developer with 7 years of relevant experience in the big data/ nosql/distributed systems sector. As any manager of a data team will know, you’ll be looking for quite a while. At Big Industries, not everyone has been there from the beginning, but as the team grows, we maintain a working environment in which all employees can leverage the collective experience of 7+ years of big data expertise to solve problems.
Apache HBase[6] is one of the services that has been part of the Hadoop stack for over 10 years and still remains popular to this day. The GeoMesa HBase Data Store is an implementation of the GeoTools DataStore interface that is backed by HBase. HBase is an open-source, non-relational, distributed database that provides a fault-tolerant way of storing large quantities of sparse data (small amounts of information caught within a large collection). It is a key-value database, and the choice of the key is crucial. GeoMesa stores spatio-temporal data by creating a key that represents the time/space location of the record in a “smart” way (check out the link[7] to find out about z-curves!).
This challenge of enabling an application using geospatial big data lies exactly at the interface between data engineering and the knowledge of the underlying data platform – vintage Big Industries.
Similar – but slightly different – tools on the market
A quick word on where the proposed stack fits in the geospatial world in comparison to other geospatial packages such as Apache Sedona[8] (formerly called GeoSpark) and Uber Engineering’s H3[9] (typically used in combination with Kepler GL[10] for data visualisations).
GeoMesa VS. Sedona
Sedona is primarily focused on processing using Spark. For example, performing a spatial join will be faster in Sedona since its spatial query optimization layer decides and executes such a request in the most efficient way. This contrasts with GeoMesa, which specializes in data persistence: storing data in a smart way so that it can be retrieved fast, while also offering options for a near real-time view using Kafka.
GeoMesa/GeoServer VS. H3/Kepler
For the Uber tools, the Spark integration is simple and user-friendly, but the Kepler tool is more tailored towards data science applications for quick analysis: it runs in a web browser on a local workstation, so you will need to narrow down large datasets before visualizing. It is not robust enough to support the kind of workloads a major enterprise typically wants to run. By contrast, GeoServer runs on a java application server like Jetty or Tomcat and excels at publishing major spatial data sources.
Stay tuned…
In the upcoming second part of this blog post, we will provide an overview of common issues encountered while working with GeoMesa, along with solutions and explanations of why these solved our problems. We believe such a consolidated overview does not yet exist and will be useful to the big data community.

[1] https://www.researchgate.net/publication/345895853_Big_Maritime_Data_Management
[2] https://en.wikipedia.org/wiki/Automatic_Dependent_Surveillance%E2%80%93Broadcast
[3] https://en.wikipedia.org/wiki/Satellite_crop_monitoring
[4] https://www.geomesa.org/; see also the following video of an opensource conference that explains GeoMesa in detail: https://www.youtube.com/watch?v=2bO7ZxiJVN8&list=PLU2OcwpQkYCzentpu11qsokJI9YEukmou&index=5&ab_channel=TheApacheFoundation
[7] https://www.geomesa.org/documentation/stable/user/architecture.html#key-value-stores-and-z-curves
[8] https://sedona.apache.org/